【雅思寫作】描述圖表趨勢的替換詞組,task 1寫作不詞窮
IELTS 雅思寫作Writing Task 1「描述圖表題」的一種題型是描述「趨勢」,例如:城市月均溫或雨量的變化、公司股價的變化。我們在這篇學習文章裡,將解釋這種題型的答題步驟,並且說明描述圖表趨勢的字彙,讓大家之後練習或上考場時,可以在有限的時間內,寫出清晰有條理的答案。
Writing Task 1寫作步驟
為了確保答案切題,我們建議考生以下寫作步驟與時間分配:
1. Plan (3-5 minutes)
2. Write (12-15 minutes)
3. Revise (2-3 minutes)
1. Plan (3-5 minutes)
在這個階段,考生需要仔細研究圖表裡的資訊,並且判讀圖表中的重要趨勢。
讓我們用以下的例題來說明:
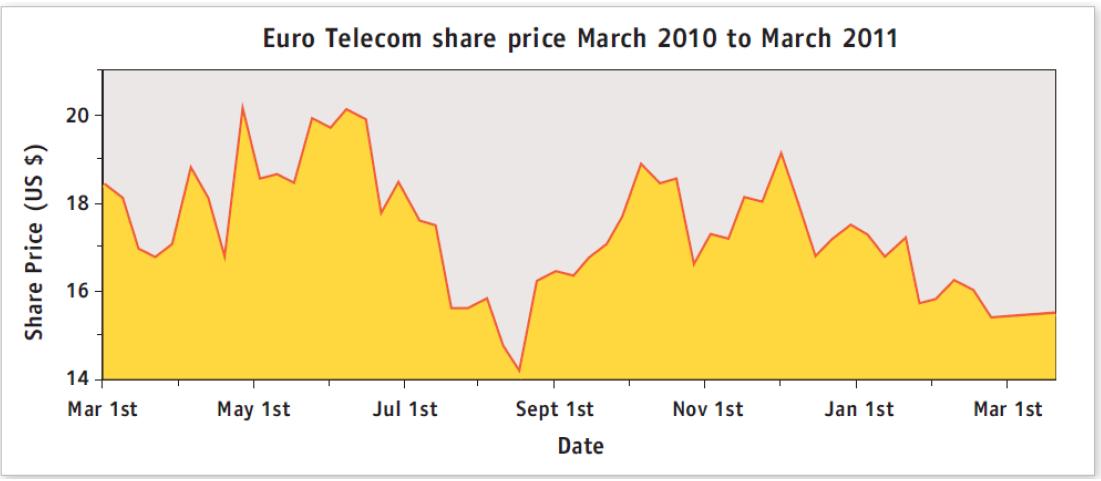
首先根據圖表的標題,以及X軸(時間)與Y軸(股價)的資訊,我們可以判斷圖表描述Euro Telecom這間公司一年當中的股價變化。接下來,我們可以把股價的變化分成幾個時期來看:
• 2010三月至四月中:股價上下震盪
• 2010四月中至五月:股價急漲
• 2010五月至六月中:股價上下震盪
• 2010六月中至八月中:股價持續下跌
• 2010八月中至十二月:股價持續上漲
• 2010十二月至2011年三月:股價持續下跌
2. Write (12-15 minutes)
在這個階段,考生利用適當的字彙與句型,描述圖表中的趨勢。
描述趨勢字彙
在描述趨勢(例如上圖的股價變化)時,我們需要熟悉描述「上升」、「下降」、「震盪」等字彙。下面的表格是相關字彙整理:
| |
動詞或動詞片語 |
名詞或名詞片語 |
| 不變 |
remain stable, remain constant, level off |
no change, a leveling off |
| 振盪 |
fluctuate, move up and down |
a fluctuation |
| 低點 |
fall to a low point |
a low point, a low |
| 高點 |
reach a peak, reach a high |
a peak, a high |
| 上升 |
rise, increase, go up |
a rise, an increase |
| 下降 |
fall, drop, dip, decrease, decline |
a fall, a drop, a dip, a decrease, a decline |
在描述上升或下降時,我們可以進一步敘述「迅速」、「持續」、「緩慢」等程度。以下表格是相關字彙整理:
| |
副詞(放在動詞後) |
形容詞(放在名詞前) |
| 迅速 |
dramatically, significantly, sharply |
dramatic, significant, sharp |
| 持續 |
steadily, gradually |
steady, gradual |
| 緩慢 |
slightly, slowly |
slight, slow |
利用不同的詞性,我們可以靈活變換寫作的句型,增加答案的文法豐富度。舉例來說,如果我們要敘述「股價在2010四月中至五月急漲」,我們可以有三種寫法:
句型一:price + 動詞 + 副詞
→ The price increased sharply from mid-April to May.
句型二:there was/were + 形容詞 + 名詞
→ There was a sharp increase in the price from mid-April to May.
句型三:price + experienced/saw + 形容詞 + 名詞
→ The price saw a sharp increase from mid-April to May.
了解這些字彙的使用方式後,以下段落是上面圖表的範例答案:
The graph shows the changes and decrease overall in the share price of Euro Telecom in a one-year period from March 2010 to March 2011.
At the beginning of this period, the share price was at $18.50 per share. There were several fluctuations until around mid-April when there was a surge from $16.50 to $20.00. This higher price didn't last long, however, and it fell before rising slightly again by June. From mid-June there was a general downward trend until mid-August when it fell to the lowest point in this period at just over $14 per share. After that, the share price recovered and, despite some fluctuations, continued to increase until it reached a peak of $19 in December. Until March 2011 the trend was downward again, ending the period at just over $15.
讓我們再看另一個例題:
The graph below shows the figures for CFC emissions in four countries between 2005 and 2009.
Summarize the information by selecting and reporting the main features, and make comparisons where relevant.
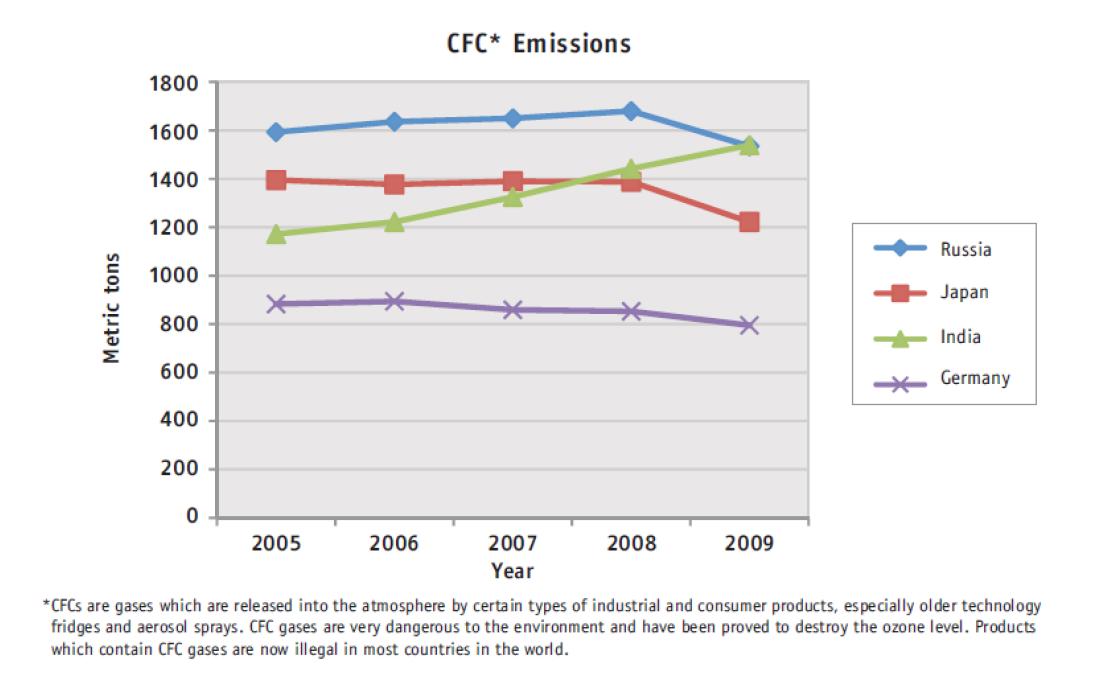
仔細觀察後,我們發現圖中的主要趨勢為:
• 除了印度之外,其它國家的CFC排放量減少。
• 印度的CFC排放量逐年增加。
寫答案時,我們建議考生使用以下的格式:
i. 主題句(introduction):說明圖表的主題。
ii. 主要趨勢(overall trends):我們所判讀的圖表趨勢。
iii. 具體細節(specific details):圖表中說明趨勢的數字細節。
當我們提到趨勢時,我們可以使用以下的句型:
• One of the first things to note is that …
• One thing that clearly stands out is that …
• A main point to note is that …
當我們引用具體細節時,我們可以使用以下的表達方式:
• For example, …
• For instance, …
• More specifically, …
• This fact is borne out when we look at …
以下為範例答案:
The line graph shows the amount of CFC emissions produced by four different countries from 2005 to 2009.
The main point to note is that CFC emissions went down in all countries except India. Germany saw a gradual decrease in emissions from 2006, falling from around 850 to just under 800 metric tons annually. However, the falls in Russia and Japan occurred more suddenly. Both countries saw a drop in emissions in 2008. Before this time, Japan had been producing a fairly constant level of emissions, around 1,400 metric tons each year, whereas emissions from Russia had been gradually increasing until 2008.
Another important feature to note is that emissions in India, by contrast, increased over the same period. In 2005, India produced just under 1,200 metric tons, but by 2009, this had increased to over 1,500 metric tons. In 2005, India produced fewer emissions than Japan and Russia, but in 2009, both Russia and India were producing equal amounts of emissions, just over 1,500 metric tons.
3. Revise (2-3 minutes)
寫完答案之後,除了檢查文句通順以及拼字正確外,考生需檢查常見的寫作與文法錯誤,例如每個句子都必須是完整的句子、動詞時態、主詞與動詞的一致性、可數與不可數名詞的用法、以及冠詞用法。
總結
在本篇文章中,我們整理描述趨勢的字彙,以及示範雅思寫作「描述圖表題」的寫作步驟。如果學員想更全面了解雅思寫作,可以參考巨匠的雅思課程。巨匠的雅思課程提供寫作批改服務,可以幫助同學發現與改正自己的弱點,取得更理想的雅思寫作成績。
課程查詢