IELTS 雅思考試學術組寫作Writing Task 1「描述圖表題」要求考生在20分鐘內,以150字描述一個或甚至兩個圖表。
雅思寫作除了注意圖表中的數字或細節之外,考生更需要描述這些細節所顯示的整體資訊,例如事物的相似或不同之處,或者事件發展的趨勢。
因此除了「描述」的能力外,Writing Task 1更評量考生的「分析」能力。考生該如何在短暫的時間內,寫出一篇有條有理的圖表摘要呢?雅思準備過程必看的雅思寫作技巧!
Writing Task 1雅思寫作步驟
為了確保答案切題,我們建議考生如下的寫作步驟與時間分配:
-
Plan (3-5 minutes)
-
Write (12-15 minutes)
-
Revise (2-3 minutes)
1. Plan (3-5 minutes)
在這個階段,考生需要仔細閱讀問題,然後觀察圖表的類型,並且判讀圖表中的重要資訊。
讓我們用以下的例題來說明:
The bar chart shows how different age groups use the Internet.
Summarize the information by selecting and reporting the main features, and make comparisons where relevant.
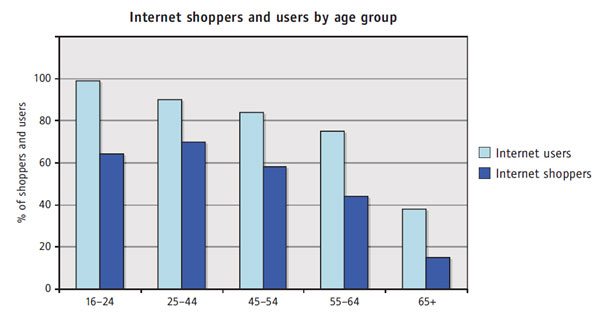
根據題目與圖表的標題,我們知道柱狀圖描述不同年齡層的人使用網路以及網路購物的比例。根據題目,我們需要選擇主要資訊,並且作適當的比較。經過仔細觀察之後,我們可以發現以下資訊:
-
多數人除了利用網路購物之外,也使用網路做其它的事情。
-
65歲以上的年長者跟其它的年齡層相比,使用網路的人比例較低。
-
不同年齡層之間,網路使用者的比例並沒有相差太多。
2. Write (12-15 minutes)
當我們分析圖表中的重要資訊後,我們就可以開始寫作。建議考生的答案採用以下的格式:
-
主題句(topic sentence):
說明圖表的主題。主題句需改寫自題目句。如果逐字照抄題目句的話,不列入答案的總字數。
-
主要資訊(main features):
即我們在Plan階段所判讀的圖表要點。
-
具體細節(specific details):
圖表中說明主要資訊的數字細節。
因為考生必須適當地比較圖表中的資訊,所以考生需要熟悉「比較」的句型,例如:
-
比較級或最高級:
-
Fewer older people use the Internet than young people.
-
The student's biggest expense was airline tickets.
-
連結詞或轉折語:
-
Although 82% of 45–54-year-olds use the Internet, only 58% make purchases online.
-
However, only 58% make purchases online.
請看以下的範例答案:
The chart shows how the Internet is used by different age groups. It looks at both general use and online shopping.
The first thing to note is that most people use the Internet for other things as well as shopping. For instance, in the 45-54 age group, 58% of people make purchases online, but 82% are Internet users, so almost 30% use the Internet for other activities as well.
Another thing to note is that fewer older people use the Internet than young people. For example, 99% of 16–24-year-olds use the Internet compared with only 38% of 65-year-olds and over.
The last thing to mention is that the number of people using the Internet doesn't vary very much between the age groups. More specifically, this is between 75% and 100% in the four younger age groups. However, it should be noted that there is a more dramatic difference with the 65-year-olds and over, where only 38% use the Internet. That is a 60% difference compared with the youngest age group.
需要注意的是,在雅思寫作 Writing Task 1只要求考生「描述」圖表中的資訊,而不需「解釋」這些資訊。所以在上面例題中,我們只需要說明65歲以上的年長者較少使用網路,而不需要試圖去解釋為什麼他們較少使用網路。
3. Revise (2-3 minutes)
寫完答案之後,除了檢查文句通順以及拼字正確外,考生尚需檢查常見的寫作與文法錯誤,例如每個句子都必須是完整的句子,而不能有「不完整的句子」(sentence fragment)、動詞時態、主詞與動詞的一致性、可數與不可數名詞的用法,以及冠詞用法。
雅思寫作中另一種常見圖表題 - 描述趨勢的圖表
讓我們再用以下例題說明另一種常見的圖表題:
The graph below shows the figures for CFC emissions in four countries between 2005 and 2009.
Summarize the information by selecting and reporting the main features, and make comparisons where relevant.
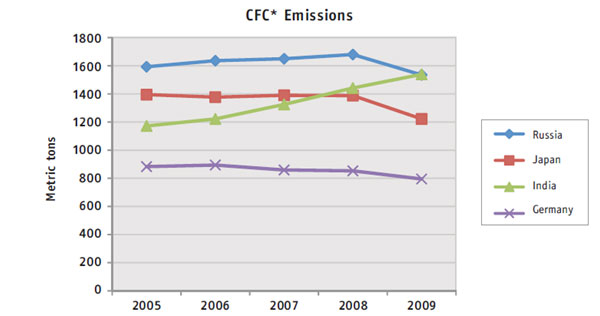
仔細觀察後,我們發現折線圖中的主要資訊為:
-
除了印度之外,其它國家的CFC排放量減少。
-
印度的CFC排放量逐年增加。
為了描述折線圖中的資訊,考生需要熟悉下列描述「趨勢」的語言:
| |
動詞或動詞片語 |
名詞或名詞片語 |
| 不變 |
remain stable, remain constant, level off |
no change, a leveling off |
| 振盪 |
fluctuate, move up and down |
a fluctuation |
| 低點 |
fall to a low point |
a low point, a low |
| 高點 |
reach a peak, reach a high |
a peak, a high |
| 上升 |
rise, increase, go up |
a rise, an increase |
| 下降 |
fall, drop, dip, decrease, decline |
a fall, a drop, a dip, a decrease, a decline |
請看以下的範例答案:
The line graph shows the amount of CFC emissions produced by four different countries from 2005 to 2009.
The main point to note is that CFC emissions went down in all countries except India. Germany saw a gradual decrease in emissions from 2006, falling from around 850 to just under 800 metric tons annually. However, the falls in Russia and Japan occurred more suddenly. Both countries saw a drop in emissions in 2008. Before this time, Japan had been producing a fairly constant level of emissions, around 1,400 metric tons each year, whereas emissions from Russia had been gradually increasing until 2008.
Another important feature to note is that emissions in India, by contrast, increased over the same period. In 2005, India produced just under 1,200 metric tons, but by 2009, this had increased to over 1,500 metric tons. In 2005, India produced fewer emissions than Japan and Russia, but in 2009, both Russia and India were producing equal amounts of emissions, just over 1,500 metric tons.
雅思寫作「描述圖表題」技巧總結
在本篇雅思寫作技巧文章中,我們示範IELTS學術組寫作Writing Task 1的寫作步驟。通過這些步驟,以及熟悉常見的句型與表達方法,考生應可在20分鐘內,寫出條理分明的答案。請持續關注我們的文章,一起戰勝雅思喔!
IELTS雅思寫作課程推薦
希望大家能透過本篇文章學習到更多雅思寫作的技巧,如果對於準備考試還是沒有信心的話,一定要來體驗我們巨匠美語的雅思課程,我們有最專業的師資和教材,除了寫作,我們也會密集訓練IELTS聽說讀寫技巧與答題策略,培養實戰的考試能力,讓你輕鬆達到目標成績!